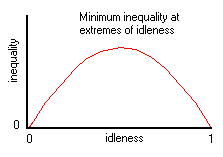
Ideally, the idleness of a society will be distributed equally across it, with all its members enjoying the same level of idleness. In this circumstance, no member of society will be any more stressed than any other. And furthermore, the envy that is likely to arise when some members are very much more idle than others will be minimized. As the idleness of a society grows from zero idleness to perfect idleness, from 0 to 1, what kind of degree of inequality can be expected?
On inspection of the matter, it may first be noted that perfectly idle and perfectly busy societies will by definition be made up of equally idle or equally busy members. And therefore perfect equality will be attained at the extremes of idleness. No such logical constraint applies to societies of an intemediate idleness. And so if equality is the expectation at the extreme, inequality must be the expectation in the middle.
A Probabilistic Approach
In a 50% idle society, all of its members may share an equal 50% idleness. But it is also possible that half of them might enjoy near perfect idleness, while the rest toil at zero idleness, so that on average all are 50% idle. And there might be a whole set of other combinations - half 60% idle, and half 40% idle, and so on.
This suggests trying a probabilistic approach to the question using dice. If an individual die represents an individual person, and the range of values of the die - 1 to 6 - represents a range of idleness from low to high, then in throwing a number of dice, one creates a society of several members each with his own level of idleness. If one throws just two dice, then the lowest idleness society occurs when 1 + 1 (average 1) is thrown, and the highest idleness society when 6 + 6 (average 6) is thrown. Intermediate degrees of idleness appear when throws produce other values.
It may be noted that there is only one combination of dice that produces the very highest and lowest possible idleness - 1+1 for an average idleness of 1, and 6+6 for an idleness of 6 -. But there are several ways in which an intermediate idleness, say of 4, can be achieved - 4 + 4, 3 + 5, 2 + 6, etc -. The number of possible ways in which any particular average value can be produced is described by a normal distribution curve.
At the extremes of idleness, individuals are equally idle or equally busy. But in the intermediate region, idleness is generally unequal. Of all the combinations of dice that can produce an average idleness of 4, there is only one combination in which individuals are equally idle - 4 + 4 -. All other ways of producing an average idleness of 4 involve the juxtaposition of unequal value - 3 + 5, 2 + 6, etc.
The inequality of a society may then be seen in the spread of values in any throw. In the case of 1 + 1 the spread of values is 1 - 1 or 0, signifying zero inequality, or perfect equality. But in the case of 2 + 6 the spread of values is 6 - 2 or 4, indicating a high degree of inequality.
Measures of Inequality
Absolute Inequality
If the 6 of a die were to represent an individual in a condition of high idleness, and a 1 was to represent one of low idleness, with the intermediate numbers representing intermediate levels of idleness, then when two dice were thrown they would fall to produce a random society of two individuals with their own unique idleness. Two 1's would be a busy society, while two 6's would be an idlesociety. The idleness of the society on a scale of 1 to 6 would be the average of the two numbers.
By this means, it can be seen that a middling idleness of 3 can be achieved by throwing either two 3's, or 4 and 2, or 5 and 1. All these add up to the same number, and all produce the same average idleness. But only on of these combinations - two 3's - produces an equality of idleness. The other two combinations produce inequality. And one simple measure of absolute inequality is the difference between the two dice. When two 3's are thrown there is an absolute inequality of zero, and when a 4 and a 2 are thrown there is an absolute inequality of 2, and when 5 and 1 are thrown there is an absolute inequality of 4. And, taking all three combinations, the average absolute inequality is (0 + 2 + 4)/3 or 2. When two 6's or two 1's are thrown, absolute inequality is zero.
If all possible combinations of the dice are explored, it emerges that there is only one combination that produces the very lowest idleness of 1 (two 1's) or very highest idleness of 6 (two 6's), but there several combinations that produce intermediate levels of idleness like 3. And so, where idleness is randomly distributed between two individuals, the greatest average absolute inequality will be found half way between maximum and minimum idleness.
 The same procedure can be repeated with three dice and four dice, and the distribution of absolute inequality across the range of idleness plotted. The graph on the right shows average absolute inequality plotted against idleness, using 4 dice each with 10 faces.
Given that using different numbers of faces on imaginary dice will produce different absolute values, these can be standardised by dividing by the number of faces, to produce a measure which - like idleness - ranges from 0 to 1.
Standard Deviation
One standard way of looking at the variability of the dice around a mean is to consider the standard deviation S of individual values, a, around the mean value, M, in a sample of n.
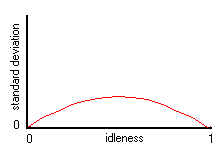 S = sqrt( sum(a - M)2 / n )
This sums the absolute diference in values of the sample, and gives a degree of scatter which is a more accurate representation than that achieved by taking the maximum and minimum. The result, shown at right, of average standard deviations of each throw, has the same shape as absolute inequality, but with a lower amplitude, as would be expected.
Using dice with faces 1 to 6, the maximum absolute inequality will be 5, and the maximum standard deviation 2.5. Where the dice represent idleness, this will range from 0 to 1, and the maximum absolute inequality will be 1. And using 2 times standard deviation, the maximum will again be 1. This particular measure of inequality will mirror idleness.
Relative Inequality
Average absolute inequality is only one of several possible measures of inequality. Using exactly the same procedure described above, it is possible to work out average relative inequality, where relative inequality is the ratio of the highest dice to the lowest in any throw. So if three dice are thrown to produce a 5, a 3, and a 2, the relative inequality would be 5/2 or 2.5. That is to say, where the numbers on the dice correspond to higher or lower levels of idleness, than the most idle member of the society is 2.5 times more idle than the busiest member.
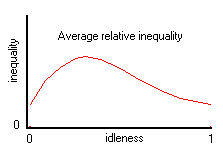 When average relative inequality is plotted against idleness, it produces a different curve, with a peak at a lower idleness than avergae absolute inequality. This is not surprising. For the same absolute inequality of, say, 1, this will be achieved with 6 - 5 at high idleness, and 2 - 1 at low idleness, but giving a relative idleness of 1.2 and 2, greater at low idleness.
All of these measures of inequality show higher levels of inequality with higher populations - or with more dice -. As populations grow, inequality grows.
The absolute measure of inequality, and the standard deviation, are both measures of the scatter of idleness in a society. But these measures do not differentiate between, say, a 20% scatter of idleness values around a high mean value and a 20% scatter around a low mean value. But relative inequality does differentiate between the two, giving a lower value for the scatter about a high mean value than the same scatter about a low mean value. In this sense, relative inequality seems a better measure than absolute unequality.
Inequality and Envy
Using various measures of inequality, it would appear that as the idleness of a society rises from 0 to 1, the chances are that inequalities of idleness will rise as while idleness is rising to 50%, and will fall thereafter. Maximum absolute inequality occurs at social idleness of about 50%, and maximum relative idleness at around 25% idleness.
Envy is most likely something that is likely to grow when a society becomes absolutely or relatively more unequal. Those who are working hard at the bottom will come to resent the idle rich at the top. And most likely they will be judging the rich relative to themselves: "They earn ten times more money than I do."
Regardless of whatever degree of inequality prevails, it is not inevitable that envy and resentment will arise. In the first place people may not be particularly interested in how other people are doing, and live private lives. And in the second place, people may not be aware of how well or how badly other people are faring, because such information may not be readily available. And furthermore there may exist strong religious or moral disapproval of envy. But where it arises, envy may tear a society apart, and reduce everyone to poverty in the process.
As such, inequalities in society may result in class struggle between rich and poor. But such struggle will not be a constant in all societies. It will mostly occur in those societies of an intermediate idleness in which such inequalities may be expected.
It is however unlikely that envy will arise where there is little objective inequality, whether it is absolutely or relatively measured. If envy and resentment grow, it is likely to be when there is a relatively high degree of objective inequality. And so envy is most probably going to be a problem in societies of between 25% and 50% idleness, assuming both relative and absolute measures of inequality come into play. In the lowest idleness societies, where there is relatively little inequality, there will be little envy. And equally in relatively idle societies, where there is also less inequality, there will again be less envy.
On the one hand, it may help to know that inequality is most likely going to arise in some circumstances, and that in the long term inequality is likely to diminish. On the other hand, the danger of inequality giving rise to envy may be minimized if economic growth - which raises social idleness - proceeds rapidly, and pushed a society through peaks of inequality. And it may also be politically wise to reduce extreme disparities of wealth, and disapprove of ostentatious displays of wealth.
The underlying thrust of this essay, however, is that inequality would seem to be unavoidable in conditions of moderately low social idleness. It remains the case that social equality is the most desirable condition, but it is very likely an unattainable goal. Perfect idleness is also a desirable aim, but it is not attainable. Why should anyone expect perfect equality any more than they expect perfect idleness?
Furthermore any measures that set out to minimize inequality will require redistributive work, and this extra work will result in a fall in social idleness. If this fall in idleness cancels out any rise in idleness due to economic growth, a society may become becalmed in a condition of inherent inequality. All that can be done is to mitigate the condition to some small extent, endure the fever, and proceed upwards to higher idleness as fast as possible.
A Physical Analogy
The human circumstance may be compared with a string stretched between two fixed points. When plucked, it vibrates, and the amplitude of this vibration will generally be greatest about half way along it, and the least at each end. Much the same applies to ocean waves, which are the largest out in the wide sea, and the smallest as they break as waves on the shore. At the shores of the sea of idleness, there are only small waves of inequality, but out in the middle the waves will very often be much larger. In human societies, these waves vibrate far more slowly than the waves on an ocean or on a plucked string, and little or no change may be observed during an entire human lifetime. But history records how entire peoples are lifted up, and then dropped down, again and again.